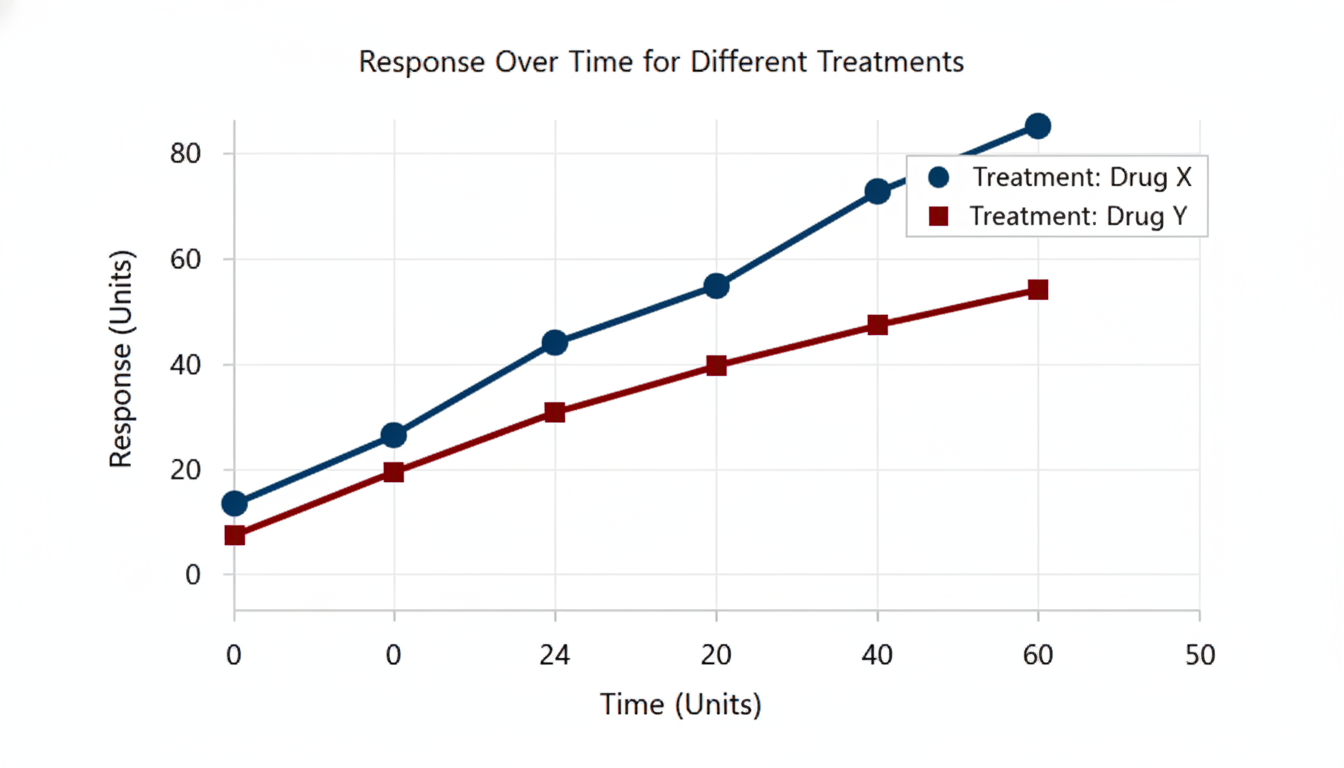
Convert this table into a line chart showing response over time for each treatment
Convert this table into a line chart showing response over time for each treatment

Convert this table into a line chart showing response over time for each treatment
A line chart illustrating empirical data.
 e0e9568df21c49ea81adf13dd19eed9e.pngGenerated file