tlooto

Visualize the correlation between temperature and plant growth over time

Visualize the correlation between temperature and plant growth over time

An empirical line graph illustrating the relationship between temperature and plant growth over time.
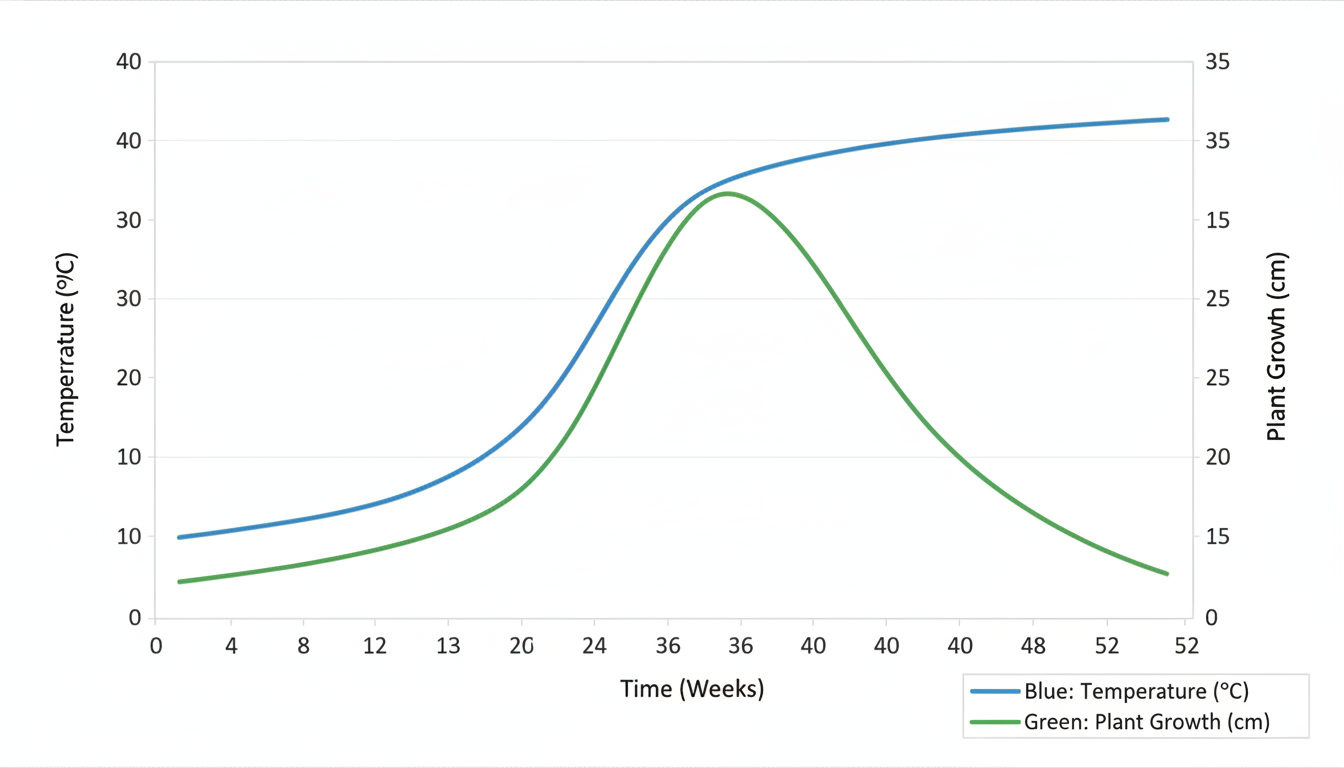
  • X-axis: Represents 'Time' (e.g., weeks, months).
  • Dual Y-axes: 'Temperature' (left) and 'Plant Growth' (right).
  • Two distinct lines: Blue for temperature, green for plant growth.
  • Aesthetic: Clean, professional, and minimalist, suitable for academic publication.
  • Features: Clear labels, units, and a legend for easy interpretation.
  • 63fa531fd6bf49ca90ea86bc57c88e57.pngGenerated file

tlooto can make mistakes. Check important information against the original sources.