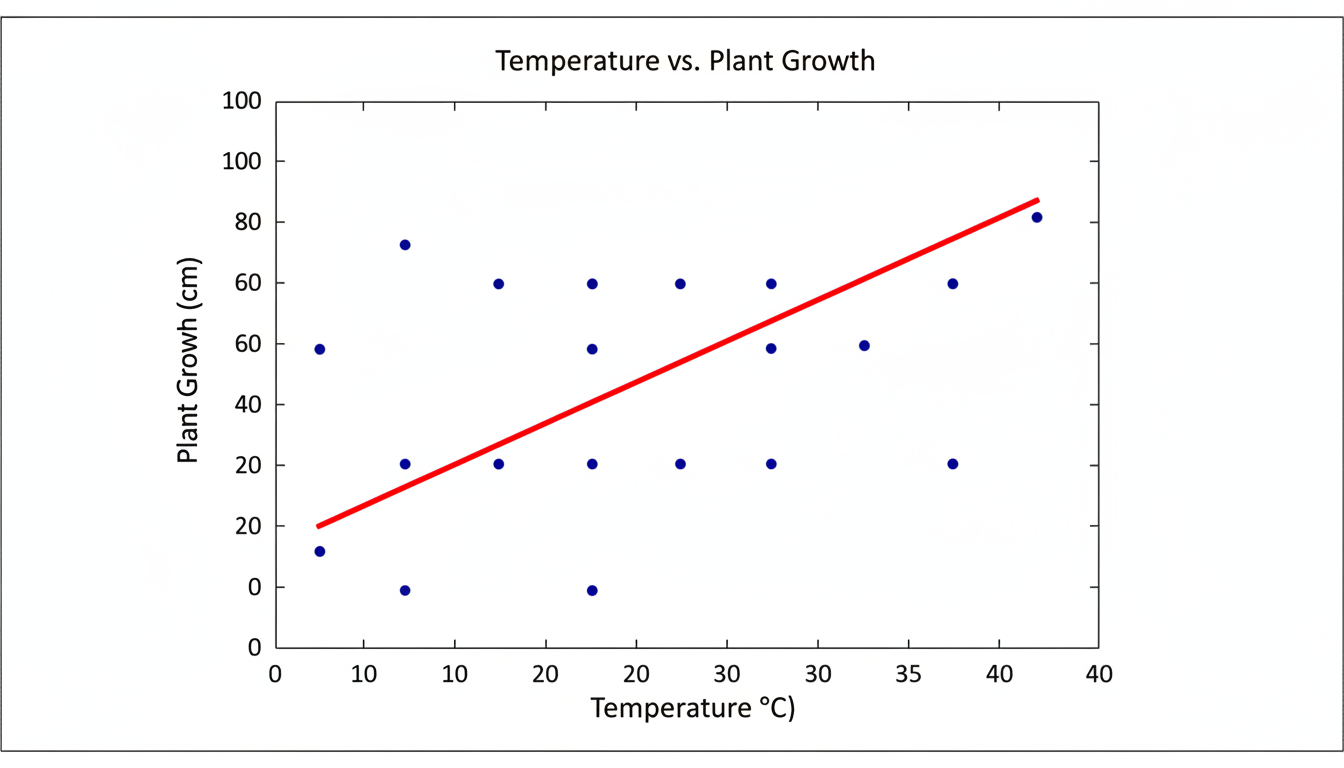
0sThis figure presents an empirical visualization of the correlation between temperature and plant growth. Type: Scatter plot with a linear regression line. Axes: Temperature (°C) on the x-axis, Plant Growth (cm) on the y-axis. Data Representation: Individual observations as dark blue circles, trend shown by a red line. Purpose: To clearly illustrate the relationship for academic analysis. Generated files0758723f0a964c94b864040cf97bce6d.pngGenerated filePreviewDownloadCopy bodyOctober 29, 2025 at 7:46 AM