이 표를 **각 처치(treatment)별 시간에 따른 반응(response)**을 보여주는 **선형 차트(line chart)**로 변환하세요.

이 표를 **각 처치(treatment)별 시간에 따른 반응(response)**을 보여주는 **선형 차트(line chart)**로 변환하세요.

29 अक्तूबर 2025 को 7:59 am बजे

A 2D line chart illustrating the response over time for two different treatments.
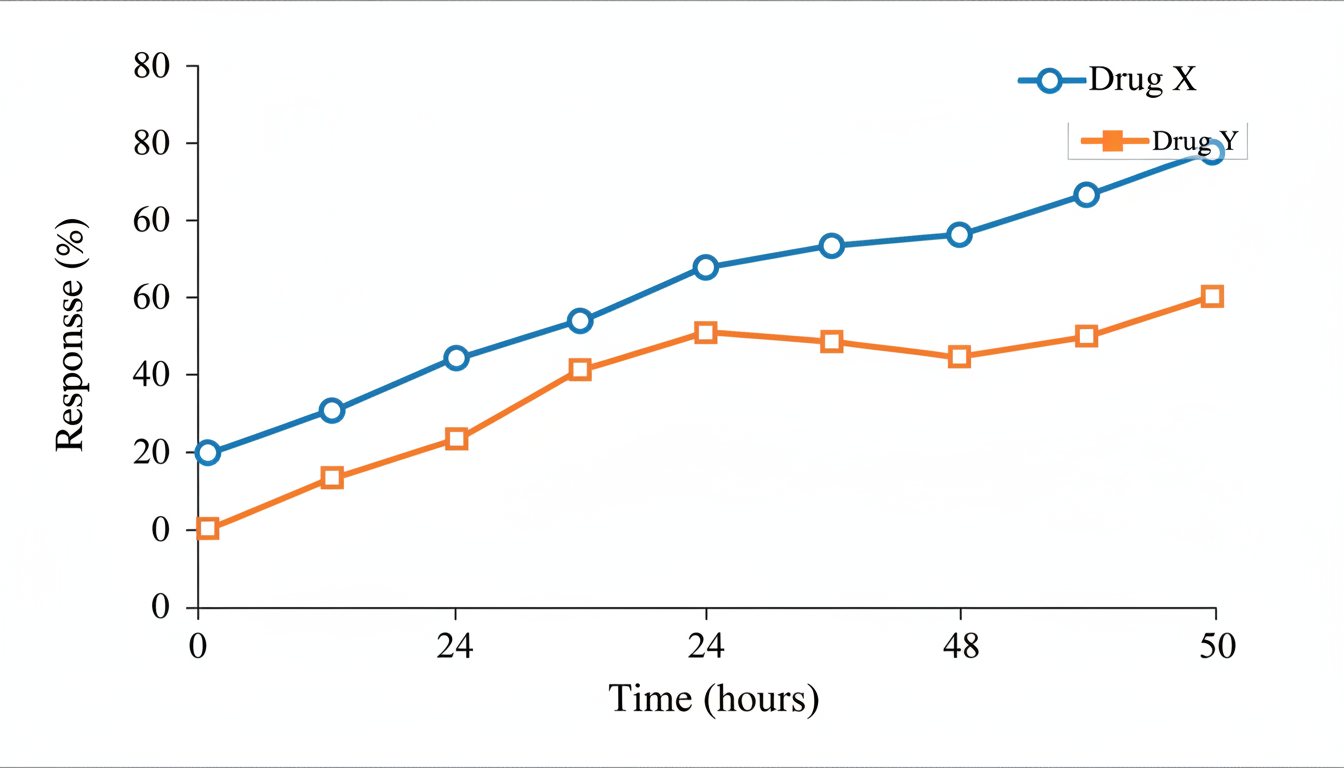
  • X-axis: Time (hours), ranging from 0 to 48.
  • Y-axis: Response (%), ranging from 0 to 80.
  • Two distinct lines:
    • One line represents 'Drug X' with data points (0, 5), (24, 45), and (48, 72).
    • The second line represents 'Drug Y' with data points (0, 4), (24, 30), and (48, 60).
  • Legend: Clearly distinguishes between 'Drug X' and 'Drug Y' in the top right corner.
  • Aesthetic: Clean, professional, and minimalist, suitable for academic publication.
जनरेट की गई फ़ाइलें
  • 4d6c40a9d29840728fe6705ed14d39cd.png

    जनरेट की गई फ़ाइल

29 अक्तूबर 2025 को 7:59 am बजे

tlooto से गलतियाँ हो सकती हैं। महत्वपूर्ण जानकारी को मूल स्रोतों से जाँचें।